What Are Core Web Vitals and How to Take Advantage of Them?

Recently, Google changed its algorithm to analyze not only your content’s quality but also the design aspects of your website that make the user’s experience easier and more fun. And with this change, Core Web Vitals have become an important ranking factor.
Ignoring the importance of usability can lead to high abandonment rates because your visitors won’t doubt before switching to the competence if they encounter too many difficulties when navigating your site.
So, to improve your SEO and assure users’ satisfaction, measuring and optimizing your usability is key. That’s why I decided to develop this brief guide on Google Core Web Vitals so you can discover how to improve them.
Let’s dig in!
1. What Are Core Web Vitals and Why Do They Matter?
If you’re new to this, you might wonder, “what are Core Web Vitals, exactly?” So, let’s discuss that for a bit before we start.
Google Core Web Vitals are a series of factors used to measure the quality of a user’s experience on a certain page. Those factors include whether a site is mobile-friendly, if it has security encryption to protect its data, or if bothersome pop-ups appear as you’re navigating, for example.
According to Google, the most important metrics to qualify a website’s usability are:
- Largest Contentful Paint (LCP), which measures a page’s loading time.
- Cumulative Layout Shift (CLS), that qualifies the page’s interactivity.
- First Input Delay (FID), that shows its visual stability.
User experience has become quite relevant in today’s digital landscape. In fact, users abandon websites quickly if they are hard to navigate! Google knows that very well, and because users are one of their biggest assets, it makes sure that a query’s first results of a search are not only relevant but also on a user-friendly site.
Moreover, keeping an eye on your site’s usability will help you provide positive experiences to users, improving their favorability towards you.
2. Main Core Web Vitals to Keep an Eye On
So, if you want to assess your site’s usability, these metrics will allow you to accurately check the usability of all kinds of web pages, no matter what they are about. Now, what do you need to know about them?
2.1 Largest Contentful Paint (LCP)
LCP allows you to calculate a webpage’s load speed from the point of view of a real user. To achieve it, this metric takes into consideration the time between clicking on a link and seeing its content appear on the screen.
What makes Largest Contentful Paint stand out from other similar metrics is how it considers what the user actually sees on their screen. Just about how many times have you seen a spinning wheel before the real content of the site loaded?
Well, LCP avoids mistakenly regarding things like these as fully loaded pages by setting the mark of “when a website has loaded” to the exact moment the main content of the page appears.
Whether it is a text block, the largest visible image, or even a video, what’s important is that users can actually interact with the page. As a result, LCP returns more accurate results that properly reflect how long they had to wait.
How Can I Check My LCP?
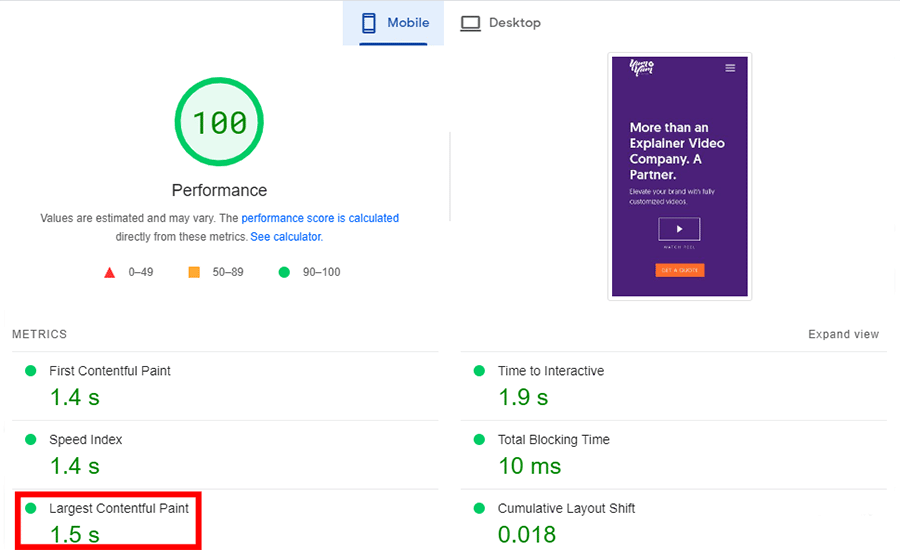
To assess your page’s LCP score, I recommend using PageSpeed Insights.
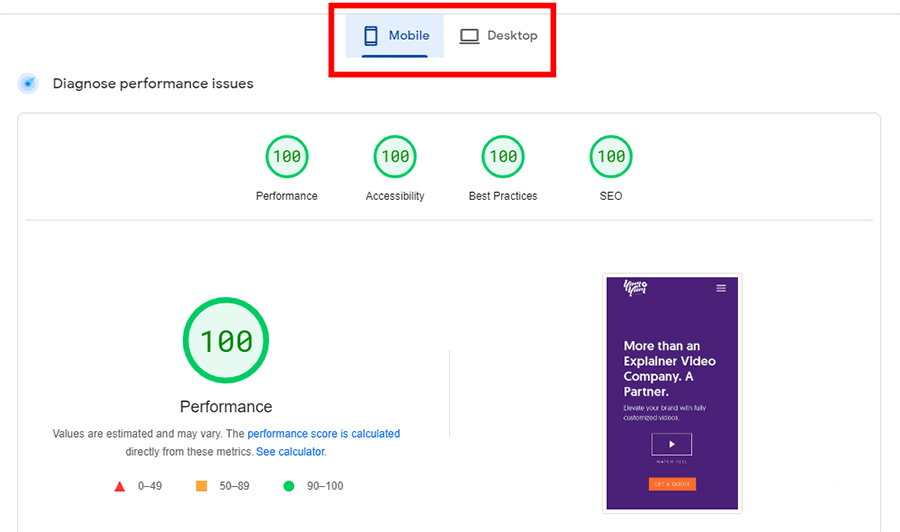
This user-friendly tool developed by Google provides a diagnosis of any performance issues on your page by comparing your results with the information they have gathered on positive users’ experiences throughout their platform. The diagnosis is divided into mobile and desktop because usability aspects vary greatly depending on the visitor’s device.
As I mentioned before, using PageSpeed Insights is quite easy. You just need to paste your page’s URL into the search bar at the top of the site, and it’ll give you a score that represents your overall result, which can be “Good”, “Needs Improvement”, or “Poor”.
A “Good” LCP needs to last at least less than 2.5 seconds.
You’ll find this information in the “Diagnose performance issues” section. As you can see, this website we developed for YumYum Digital nails the score. Yay!
2.2 First Input Delay (FID)
When looking a the most important Core Web Vitals, you can’t forget about First Input Delay. This metric measures the time between a user’s first interaction with a page and the moment the browser starts processing event handlers in response to that interaction.
Let me translate this to English: FID tells you how long a user has to wait when they interact with your page. Easy, right?
An interaction can be anything from clicking a tab on the menu to even entering text in a field. What isn’t considered an “interaction” are actions like scrolling or zooming. For that reason, your FID rate will depend strongly on the type of page you are measuring.
If it’s a blog post, for example, users won’t interact much, as scrolling isn’t considered an action. But if it is a login page that you have, your FID time should be relatively short, or your users won’t be completing any actions.
This Core Web Vital metric focuses on the user’s first impression of your site’s responsiveness. Remember that they won’t hesitate to leave your website if it can’t load quickly enough, which is why this metric is so crucial.
How Can I Check My FID?
Google’s PageSpeed Insights will also help you measure your FID. After entering the URL into the search bar, you’ll see the same diagnosis I mentioned before.
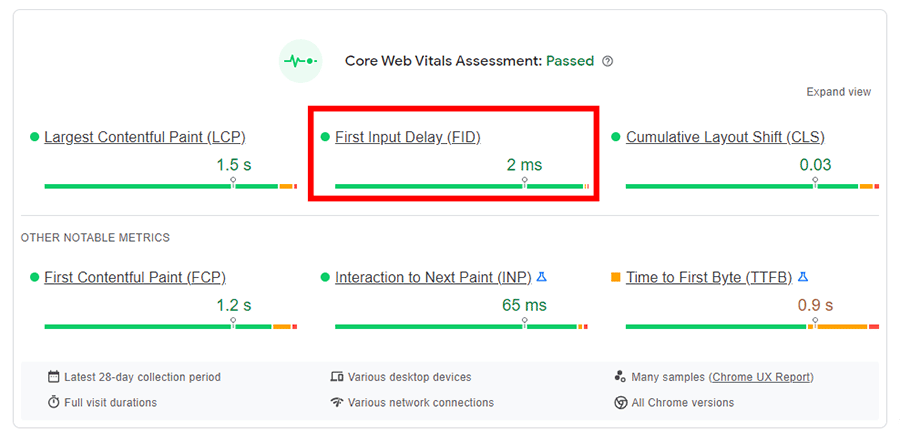
Ideally, your First Input Delay should be less than 100 milliseconds. Anything beyond that will give the user the impression that the system is reacting too slowly, which will almost certainly lead to user abandonment.
After placing your page’s Url in the search bar, go to the “Discover what your real user’s experience” section, to check out your FID score:
The first input delay on this website we worked with was only 2 ms. Talk about not making clients wait!
Keep in mind, as I said before, that not every page view results in an FID entry. Because FID is a measure that relies on actual user data, you need to have previous user interactions with your site for it to work. If that condition isn’t met, your results could look like this:
2.3 Cumulative Layout Shift (CLS)
Have you ever tried to click a button or a link on a website, only for it to suddenly dart away? This is called a “layout shift,” and it occurs when a visible element suddenly changes its position or size, moving the content around it.
When a website loads, there are more chances for this to happen, as elements load one after the other. The Cumulative Layout Shift metric calculates the total amount of unexpected shifts that occur on a page during this process, gauging its visual stability.
You’ve probably already experienced a page layout shift at least once in your life, so you know that, as a user, they can be pretty bothersome. Clicking on an ad you didn’t want to or accidentally completing a purchase… Layout shifts can make a user’s experience pretty difficult and annoying.
And the issue is that, when developing a website, we often won’t take notice of them. Luckily, you can easily measure this important metric just like any of the other Core Web Vitals.
How Can I Check My CLS?
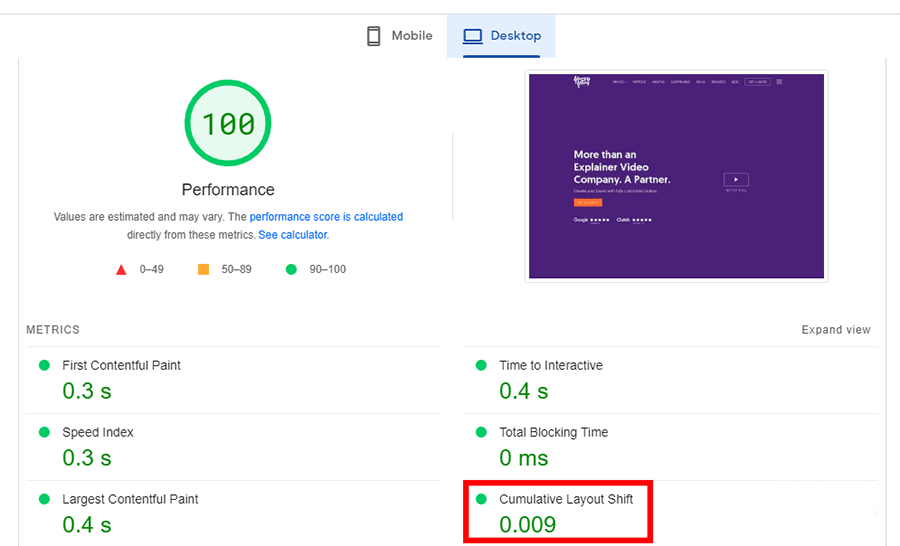
Yes, you guessed it: you can measure CLS on Google’s PageSpeed Insights!
You’ll find this metric in the “Diagnose performance issues” tab. Your score can be classified as follows:
- Good, if it’s below 0.1.
- Needs improvement, if the metrics round between 0.1 to 0.25.
- Poor, if your score is above 0.25.
A fully static page can score as low as 0, so that’s the ideal number to aim for. If that’s not possible, the smaller the number, the better.
Make sure to check your score both on the website and the mobile tab. Shifts in mobile screens have a more significant impact on mobile user experiences, so you’ll have to do your best to avoid them.
3. How to Improve Core Web Vitals
After measuring your metrics, the tricky part starts. If your results were good— congratulations! If not, well, keep reading because this section is for you.
3.1 Implement Lazy Loading
Lazy loading is an optimization technique that makes it so online content only loads when visitors scroll down. This way, the user’s browser focuses on what’s on display, and any non-critical resources are only loaded when needed and thus, your Core Web Vitals, both LCP and FID, will see quite a boost.
For example, images present from the user’s viewpoint will appear immediately during the initial loading. However, elements outside of it will be replaced by placeholder images until they scroll through them.
3.2 Use a Browser Cache
Browser caching is a process in which data is temporarily stored in web browsers. The first time a visitor enters a website, a series of resources, like images, HTML files, and JavaScript files, have to be downloaded for the site to function,
With caching, the next time that same user visits the page, loading will be faster as these elements will already be stored on their browser. A faster-loading website will also allow for faster processing of interactions, improving your FID scores, and your overall Google Web Vitals.
3.3 Remove Non-critical Third-Party Scripts
Third-party scripts are pieces of code that people commonly embed on their websites to improve functionality. These third-party scripts use the connection to your website to gather information, provide tracking, or even integrate new functions from other sites, such as social widgets, like the Facebook Pixel.
Although third-party scripts are very helpful, some of them can negatively impact your Core Web Vitals. These lines of code can prevent your own scripts from executing on time, which will negatively impact your website’s speed and interaction.
Remove them one by one, and then measure your metric scores as you add them to find out which third-party scripts may be the ones causing trouble.
3.4 Opt for Personalization
While using templates and plugins can be a great idea when you’re just starting out, it can complicate things for you down the road. Your website might start with only text and images, but once everything’s on track and it starts growing, you might want to incorporate other elements, like videos or an ActiveCampaign form. If you use a different plugin for every single element on your website, your performance will start dropping.
So, I strongly recommend opting for personalized web development that keeps your Core Web Vitals at 100/100 while making your website look good. If you don’t know how to start tackling that, you can always get some professional help to take care of the project for you 😎. If this sounds like something you’d be interested in, don’t hesitate to send us a message; we’d be happy to give you a hand!
Wrapping Up
Providing good experiences to your users isn’t always easy, especially when we’re often too deep in the development process or too accustomed to our own sites to notice usability issues.
This is what makes Core Web Vitals essential because they provide helpful insights into what isn’t totally working as it should on your pages.
Measuring is only the beginning, the next step should be actually taking action to fix the problems you’ve found. Luckily, I’ve made sure to include some actionable tips to give you a hand with that too. Now you’re ready to get down to business!


